Sunday, 27 August 2017

MODEL EXPERIMENT- AN INSIGHT TO EXPLORE RESISTANCE


When any new-building order reaches the designer and consequently the shipyard, the owner mentions a list of soft information about the ship among which speed is a crucial parameter and there are a lot of liquidated damages associated with it. Now for a designer to finalize the ship speed and the engine power, he requires to find out the resistance and propulsion characteristics after deciding the hull form of the ship. These hull resistance and propulsive characteristics of a vessel are determined by performing model experiments on a scaled down model of the vessel. 

Resistance model experiment is performed for the following reasons:

  •                 To obtain the desired ship resistance in a scaled down model and extrapolating the value to full scale.
  •                To determine the flow pattern and flow induced vibration in a ship model scale so that in model stage corrections in hull form or alignment of hull appendages can be made to ensure streamline flow around the hull.

The flow around the model hull is observed using:
  •       Wool tuft test
  •       Paint flow test

In both the tests the path lines of the fluid are traced and they are compared with streamline flow.


Wool tuft test showing path lines of flow around hull (Courtesy: Google Images)


Paint flow test depicting flow around the hull (Courtesy: Google images) 


REQUISITE OF A RESISTANCE MODEL EXPERIMENT

Resistance model experiments are based on 3 similarities between ship and model for extrapolation of model data to actual ship scale. The similarities are as follows:


Geometrical similarities

According to Froude Law of Similarity the vessel and the model should be geometrically similar. That is the linear dimensions of the ship should be proportional to the linear dimensions of the model. This constant is called scale factor.   

              Scale factor(λ)= linear dimension of actual ship/ linear dimension of model      

   
Similarly all the area ratios are proportional to (λ2) and the volume ratios like displacement are in the ratio of (λ3).

 Kinematic similarity

This similarity is also based on Froude Law of Similarity and states that  the model should be operated in a towing tank with corresponding speeds related as shown.

                      Corresponding speed =  Speed of ship/ (λ)^(.5)

   
Dynamic similarity

This similarity relates the fluid dynamics associated with the ship. This similarity states that the wave pattern around the model and actual ship hull should be the same. Residuary resistance of a ship is a function of the wave dynamics associated with the ship. Actually in practice when we maintain geometrical similarity and we are dealing with potential flows the dynamic similarity is automatically maintained. 


PROCEDURE OF A RESISTANCE MODEL EXPERIMENT


In a model experiment, geometrically similar model is manufactured of wood or wax and bamboo composites or FRP or even PVC foam. The size of the model depends on the scale factor used. The model cannot be manufactured to exact perfection as geometrically similar to the actual ship due to efficiency of machinery and manufacturing process, where minute errors are inevitable.  Thus, a tolerance of 2 mm and 1 mm is allowed for length and breadth respectively.            


Wooden and FRP model of a resistance test (Courtesy: Google Images)
                               
A larger model is always preferred since it is easier to manufacture and is more accurate. But the length of the model is restricted on the tank dimensions to avoid blockage effect. 

According to ITTC, to avoid blockage effect the following measures need to be pertained to:

  1. L<  d
  2.  Lm  <  *w
  3.  AXm < *Ac

Where,
              Lm = Length of the model
              AXm = Area of midship of the model
              Ac = Cross-sectional area of the towing tank
              d = Depth of the towing tank
                            w= Width of the towing tank


Blockage effect is primarily related to the wave making resistance. Thus for slow speed vessels where the wave making phenomenon is low enough to ignore, the blockage effect can be overlooked.

The models after manufacture is then ballasted to its required draft line and trim conditions. The draft of the model is generally kept according to the load water line (LWL) of the designed vessel. The model is then fixed to a carriage provided in the towing tank. The carriage is operated electrically or hydraulically which tows the model ahead at certain predetermined speeds. The carriage is fitted with a resistance dynamometer to measure the towing force required to tow the ship. The resistance dynamometer is attached to the model using pillars. These pillars are fixed but the pillars allow the model to heave and trim so as to maintain dynamic similarity.


Model experiment for resistance conducted in a carriage (Courtesy: Google images)

It is known that different components of the resistance sums up to total resistance that act on the vessel opposite to the direction of the model velocity. This total resistance acts on the centre of force of the total resistance and it is assumed to be at half draft above the keel or slightly lower than that. The model is towed from that point such that no moment is created that would trim the vessel leading to augment of the model resistance. Generally for merchant vessels with Froude Number (Fn) <0.3, this assumption holds true. But for high speed vessels, especially for planning crafts, where there is a lift of hull due to hydrodynamic forces there the towing force is applied further down to reduce trimming of the model.


PROBLEMS DURING A RESISTANCE MODEL EXPERIMENT

  1. One of the primary problems encountered during model experiment is augmenting of the resistance of model due to blockage effect. This phenomenon can be avoided by following the ITTC rules for model and tank dimensions mentioned earlier.
  2. One of the main problems of model experiments is Laminar flow around the model. We know for a ship 
Reynolds Number (Rn) = .

                Where,
                                v = Velocity of ship.
                                L = Length of ship.
                                ν = Coefficient of kinematic viscosity of water. 

Assuming coefficient of kinematic viscosity of sea water and fresh water (generally used in model experiment) to be the same. There since,

Lm/Ls=1/λ

Vm/Vs= 1/(λ)^(.5)

So,

Rnm/Rns=1/(λ)^(3/2)  . Where the symbols have their usual meanings

Thus Reynolds Number similarity of the model not being maintained, laminar flow prevails around the model than the turbulent flow that prevails for the actual vessel. Also considering boundary layer formation around the bow of the actual vessel laminar flow prevails which after some length become turbulent. But model length being small, only laminar flow prevails around it.

As shown by Blausius and Prandtl-Von Karman, for laminar flow the coefficient of frictional resistance (CF) is less in comparison to turbulent flow and there is a decrease in extrapolated resistance value for actual ship.


Difference in coefficient of frictional resistance for laminar and turbulent flow (Courtesy. - Google images)


Response turbulence simulators like trip wire, sand strips, studs, etc. are fitted along the fore part of the ship at 5% of LOA or sometimes at 5% and 10% of LOA to stimulate turbulent flow around the model hull. 


It should be considered that the turbulence stimulators do not add to excess of appendage drag to the model. For this an alternative came up to stimulate turbulence in the towing tank in front of the model using turbulence stimulators attached to the carriage. Thus there will be no attachment of the stimulators with the model hull and appendage drag is omitted.


Due to laminar flow around the hull the CT vs. Rn graph is obtained incorrect. At low speeds where coefficient of residuary resistance (CR) is negligible often coefficient of residuary resistance (CT) line goes below CF line which is obtained from the ITTC formula

 CF = (1+k)*0.075/(logRn-2)^(2)

At that point it is inferred that the flow around the model is laminar and turbulence has to be stimulated.


METHOD OF EXTRAPOLATION OF A RESISTANCE MODEL TEST RESULTS TO FULL SCALE


  1.                         From the design parameters we know the Length of model (Lm), Displacement of the model (Δm) and the Wetted surface area of model (Sm).
  2.          .      From the carriage dynamometer readings we measure the Velocity of the model (preset) and the total resistance of the model (RTm). 
  3.            The particular dimensions and the velocities of the ship and the corresponding model are used to find out the Reynolds number of the ship and the model (Rns and Rnm). This Reynolds number information is used to calculate the coefficient of frictional resistance for the ship and the model (CFs and CFm). 
  4.           .       Then the Frictional resistance of the model is calculated and deducted from the measured total resistance of the model to find out the residuary resistance of the model. This residuary resistance is extrapolated to the actual ship scale according to Froude’s Law of similarity. The frictional resistance of the ship is calculated according to the ITTC formula
                                 RF (1+k)*0.075/(logRn-2)^(2)* .5*(ρSW*vs2* Ss).
  5.                         The total resistance of the ship is thus obtained by summing the frictional resistance, residuary resistance, Appendage resistance, Air resistance and Correlation allowance.  Correlation allowance is an augment of the total resistance of the actual vessel based on the fact that the surface smoothness of model (25 micro m) is more than that of the actual ship (150 µm). So model experiences less resistance than the actual ship. Air drag and correlation allowance is calculated based on the given formulas
    RAA = CD* *(ρAir)*AT*VR2        
Thus the total resistance is:

RTS =  (Sapp+Ss)/Ss*(RF + Correlation allowance) + RR + CAA

This resistance value is used to calculate the effective power of the vessel given by the formula:

PE = RTS * VS
                                                                                                          

INTERESTING FACTS ABOUT RESISTANCE MODEL EXPERIMENTS


By definition the resistance if a ship is calculated with a constant ship speed. Had the ship being accelerating an extra force would act on the ship due to fluid dynamics called the ‘added mass force’. In the model experiment when the model accelerates to attain certain preset speed there is an augment of the resistance value due to this ‘added mass force’. Thus resistance value is only measured after a steady speed is attained. That’s why towing tanks are made long enough such that the first few metres required to tow the model to a constant speed can be ignored and these extra effects can be ignored in computing the final resistance. 


TYPICAL RESISTANCE DATA GRAPHS OBTAINED FROM MODEL EXPERIMENTS

Typical graph for coefficients of model resistance for a 450 t Oil Tanker (Copyright: NSDRC, Visakhapatnam)


  1.   
Typical graph for coefficients of ship resistance for a 450 t Oil Tanker (Copyright: NSDRC, Visakhapatnam)


e

Typical graph for ship’s effective power vs. ship speed for a 450 t Oil Tanker (Courtesy, NSDRC, Visakhapatnam)


Symbols Index:
λ
Scale factor for model
ρAir
Density of air
ρSW
Density of sea water
ΡFW
Density of fresh water
Lm
Length of the model
Ls
Length of the ship
d
Depth of the towing tank
w
Width of the towing tank
AXm
Area of midship of the model
Ac
Cross-sectional area of the towing tank
Velocity
L
Length
Coefficient of kinematic viscosity of water
vm
Velocity of model
vs
Velocity of ship
Rnm
Reynolds number of model
Rns
Reynolds number of ship
CT
Coefficient of total resistance
CR
Coefficient of residuary resistance
CF
Coefficient of frictional resistance
k
Form factor of the model
Δm
Displacement of model
Sm
Wetted Surface area of model
Ss
Wetted Surface area of ship
Sapp
Wetted Surface area of appendage
Fns
Froude number of ship
Fnm
Froude number of model
CD
Coefficient of air drag
AT
Equivalent transverse area of ship exposed to wind
VR
Relative velocity of the wind with respect to ship
PE
Effective power
          
           Article By: Rijay Majee


Friday, 4 November 2016

Briefly exploring Damage Stability of Ships


As we already had a brief insight from one of our previous articles, 'Stability' is defined as the phenomenon of a ship to resist external or internal loads on it and to acquire its original upright state on removal of the external or internal loads. Stability is a crucial phenomenon governing ship design and seakeeping performance of a vessel.

Moreover they can be classified into two types: 
·   Intact stability
·  Damage stability

But how much are we sure of the fact that a vessel becomes unstable only when there is undamaged condition? In fact, the reverse is in often more likely, that is the ship has suffered a breach or damage and is structurally affected. This in turn has triggered flooding of water leading to loss in stability. Loss of stability can also be caused by other factors without involving damage, various causes being explained in the previous article. 

Figure 1: (Copyright: Wordpress)


DAMAGE STABILITY


This type of stability concerns with stability of the ship when it is damaged, usually hull is breached. It includes of flooding of ship compartments when hull is damaged leading to sinkage of the ship below margin line or even total sinkage or capsize of the ship. In this article we would focus mainly on damage stability.

     A ship gets damage or suffers a breach mainly because of one of the following causes or sometimes their combination:

  •  Collision: This is a very common reason often leading to adverse effects. Collision may be with another vessel (remember Titanic?) or some landmass like harbor, port, reef or island. Most of them are caused by compounded operator error, carelessness, technical flaws, machinery and equipment failure, problems in maneuverability, accidents or sometimes unavoidable circumstances leading to damage.
  • Grounding: Grounding is often caused by improper draft considerations in water bodies, excessive trim or in shallow draft conditions. 
  • Structural problems: Sometimes there is lack of structural soundness due to manufacturing defects, improper behaviour, lack of maintenance, fatigue or unprecedented loading.
  • Environmental Vagaries like rogue waves, cyclones, sea-storms, heavy rainfall or sometimes cold weather conditions leading to ice accretions. It may be worthwhile to mention that icebergs which are very much prevalent in northern seas are very big problems for navigation which can often lead to precarious collisions just like in case of Titanic.  

CLASSIFYING DAMAGE STABILITY


         So far we have introspected upon the causes that hampers the stability of the vessel after wreaking damage. But broadly, damage stability may be classified into two groups: 
  •     Deterministic Damage Stability
  •     Probabilistic Damage Stability

        Deterministic Damage Stability
   
      This is the traditional old-school technique for assessing stability of the ship when it is  flooded. In this process the ship is divided into several subdivisions along its length with the help of transverse watertight bulkheads. Now the stability of the ship is calculated when one or more compartments gets flooded due to breach of hull.

WAYS IN WHICH A SHIP SINKS

A ship can sink in usually 3 ways when its hull is damaged giving way for flooding. 

FOUNDERING

It is the case when a ship runs over some reef or rock and it damages its bottom keel and consequent flooding occurs. Due to flooding the ship’s draft increases to compensate the lost buoyancy and sinks when Weight > Buoyancy. One important thing is that foundering does not necessary lead to heeling of ship is the weight distribution is still properly maintained. However, due to flooding of the damaged compartments may lead to direct sinkage and sometimes trim. 


Figure 2: Damage in hull due to Foundering (Courtesy: NEEC)


CAPSIZING 

This is the most common problem in regard to stability. However, it is treated differently in case of intact and damage stability. 
In intact stability, the preliminary condition is that the ship remains 'undamaged'. Now what could be the cause for a vessel to capsize without suffering physical damage? The answer is simple. As the loss of stability is solely caused by the loss of equilibrium of forces, the most occurrent cause is due to shifting of cargo or injudicious distribution of weights (cargo, ballast, machinery etc.) which triggers of the ship to heel to one side in a local phenomenon termed as Listing. However, in dealing with damage stability problems, we isolate the causes caused due to internal effects and merely concentrate on the damaged aftermath stability conditions. 
In damage stability criterion, capsizing is caused due to the breaching of hull after suffering damage sideways which can cause water flooding in that region only (tanks, cargo spaces etc.). This sudden flooding of water causes the ship to heel to one side accounting to its loss in equilibrium. 
As illustrated in the figure, unwanted flooding of a compartment or space leads to drastically altered buoyancy forces along with their lines of action. This difference in the line of action of the overall buoyancy of the damaged ship with respect to the weight still acting through its center of gravity creates a large heeling moment causing it to topple and finally capsize. As a result, it heels over large angle such that its righting moment is insufficient and it topples over. This happened in the disaster of ship COSTA CONCORDIA due to the collision.   


Figure 3: The capsizing of ship due to heeling moment


 PLUNGING

This depicts damage on a longitudinal basis. This aspect of damage generally deals with flooding in the fore and act regions. The causes can be in plenty from head-on collisions (like in a case of Titanic) to leakage in the hull skin. The unwanted seepage of water in the fore and aft is not as severe as capsizing. Moreover, with the development of watertight bulkheads dividing the hull into numerous watertight compartments from fore to aft, the risk is less posed (as even if the fore or the aft peak bulkhead got flooded, the remaining watertight compartments would remain safe due to their watertight integrity). Plunging only has a negative impact of trim (either by bow or stern). Trim is much more acceptable as compared to sideways heel when it comes to stability criterion but still can have detrimental consequences if deck immersion takes place, that is waterline reaches up to the weather deck and then flooding it. In the worst case scenarios, this creates a high trimming moment beyond revival making the ship succumb to its damage, sinking it by bow or stern. 

The following figures illustrate. 


Figure 4: Gradual Capsizing due to trim 


EFFECT OF FLOODING ON STABILITY

We have so far expressed concerns about flooding which can affect stability. But have we thought about the simple physics that governs them?

When a ship floods its buoyancy is lost but displacement V remains same. So the draft increases to regain the lost buoyancy. As the draft increases the waterplane area (AW) decreases. Thus 

              View  Vold , the volume remaining the same
                                    Aw(new)<Aw(old), accounting to the hull form
                                        
                                           So,
                                            IT(new) < IT(old) , Area Moment of inertia of waterplane

                                        We know, from stability calculation relations BM= IT /V .

                                        So BMnew < BMold .
                                        GM = KB + BM – KG .


Figure 5 : Courtesy: NEEC


Now due to flooding KB will increase (due to increased draught) and BM will decrease (see figure). As a combined result GM decreases. Now as GM decreases the righting lever GZ  decreases and the stability of the ship as a whole,decreases (refer figure 5). 

Figure 6: Conditions of Transverse Statical Stability 

SUBDIVISION AND FLOODABLE LENGTH

In deterministic approach of damage stability, the ship is divided into several subdivisions. This is done to restrict flooding of the ship on hull damage.


Figure 7: Division into watertight bulkheads (Image Courtesy: NEEC)


Essentially in all ships, the hull is divided into a number of watertight compartments by the means of watertight bulkheads. The physics behind this development is intrinsically related to damage stability. Say, on a particular occasion, the ship hull gets breached. It will get flooded, of course. But with the subdivision into compartments, the risk of sinking is very much lowered. Even if flooding occurs, it is limited to one or a few bulkheads. On the contrary, if there were no bulkheads, the entire hull (Cargo holds, machinery spaces, engine room, accommodation etc) would have flooded beyond limits, making the ship the to sinkage.However, if damage takes place across numerous watertight compartments beyond the maximum limits of flooding (change in draft, of course), the ship may be in the precarious conditions of sinkage.Remember Titanic? It had grazed past the iceberg in an attempt to maneuver the past, inflicting damage to many of its compartments comprising for its watertightness, resulting in its deadly aftermath. Instead, if it would have directly rammed into the iceberg, the Fore peak tank and at most a couple of subsequent compartments would have flooded saving the rest. This could have prevented the catastrophe. 

Thus, invariably all modern designs maximize the number of watertight bulkheads to account for 'Damaged Stability.'

Here all subdivisions are done according to its ability to resist flooding in damaged conditions to the safest limits. Floodable Length is an important parameter taken into account here. It is defined as the maximum length of the compartment that can be flooded such that the draft of the ship remains below the margin line. Thus, maximum division of bulkheads is the best solution. But, other factors such as minumum required size of hold, improper cargo stowage, more number of required outfittings or increased steel weight hinders the possibility to some extent. Thus, optimizing the safe limits of floodable length to the minimum required length of watertight compartment are done in most cases. 


Figure 8: Watertight Subdivision of a ship (Courtesy: Wikipedia)

FLOODABLE LENGTH CURVE


Suppose the ship is divided into a certain number of  transverse bulkheads. Now each compartment has its floodable length. The lengths of the floodable lengths are plotted vertically from the midpoints of the horizontal floodable lengths and these points are joined together. 

Figure 9: Floodable Lengths (Image Courtesy: NEEC)


The end and starting points of the curve is joined with the aft and forward keel of the ship (profile view). This gives us the floodable length curve.
Figure 10: Floodable Length curve (Image Courtesy:NEEC)


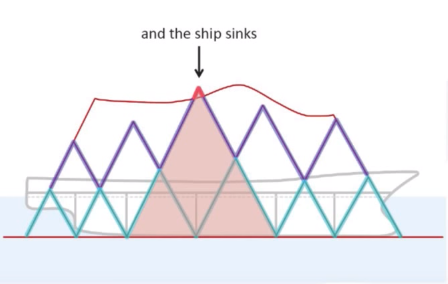
At first for a vessel the factor of subdivision (FOS) is calculated. The FOS depends on the length of the ship and other numerical factors. The inverse of FOS gives the compartment standard of the ship. One compartment standard means the ship will survive if one compartment is flooded. The product of FOS and floodable length gives the permissible length. The length of a compartment cannot be greater than permissible length. The area under floodable length curve is the maximum extent a ship can be allowed flooding to prevent the ship to sink. For a single compartment, flooding triangles are formed from the edges of the bulkheads with the height equal to permissible length. This is the actual floodable length curve for single compartment flooding. This curve also gives the stability of the ship if one or multiple compartments are damaged.

Figure 12: Image Courtesy:NEEC


If for any single or group of compartments flooding the area of the actual floodable length curve exceeds the allowable floodable length curve then the ship will sink. 


Thus if the third bulkhead from aft of the ship damages the ship will sink since it’s floodable length curve exceeds the allowable floodable length curve.


Figure 11: Floodable Length estimates for a damaged hull profile (Image Courtesy: NEEC)


PROBABILISTIC DAMAGE STABILITY

In deterministic approach we had subdivision to restrict flooding and the sinkage of the ship if one or more compartments are flooded can be retrieved from floodable length curve. But in reality, we don’t know whether a ship will be damaged in a voyage or not. If it’s damaged how many compartments will be flooded? Will it be damaged by aft or forward? Will it plunge or capsize or founder? There is a lot of uncertainty involved. 

The theory of probability solves this problem. With the help of probability, we find,

  • How ships are damaged?
  • How often is a part damaged?
  • What is the chance of survival if that part of ship is damaged?
We find the probability of each case and multiply the probabilities of each constraint. Finally, we add the total probability to get the chance of survival of the ship according to the damage occurred.


Figure 12: Sample Probabilistic  Tables


ATTAINED SUBDIVISION INDEX


Figure 13


Attained subdivision index is the sum of all probability of surviving for 1 compartment flooding, 2 compartment flooding, etc.
A = P(one compartment flooding) + P(2 compartment flooding) + etc.
A > R.
     
Where R = the required subdivision index.

Thus the damaged stability of vessels is calculated which decides the overall stability of the ship when it is damaged and tell whether the ship will survive sustaining the respective damage.LSD

Article By: Rijay Majee