Sunday, 19 October 2014

MOL Comfort- What Happened? (Part 2)

Flashback

In Part 1, we focused on the position of the crack on the hull girder, following which we saw how Class NK estimated the wave induced loads on the ship during the accident scenario, considering required uncertainties in the parameters. Based on the above obtained wave loads for different sea states, the maximum and minimum wave induced vertical bending moments were estimated.Having estimated the wave induced load, it was now required to estimate the hull girder strength (of the considered three hold model). This article is about to discuss the methods involved in calculating the strength of the structure, and obtained results of the same.


3-Hold Model for Strength Analysis

The region of failure was identified by field investigations. So for the finite element analysis, a three hold model was considered. Further conditions taken during the analysis were obtained from Class NK Guidelines for Container Carrier Strength (Guidelines for Direct Strength Analysis, 2012) as shown in Table 1.

Table 1: Conditions for 3-hold model analysis.
(Courtesy: Class NK)
Fig. 1: 3-hold model used for analysis. (Photo edited)
(Courtesy: Class NK)


Estimation of Ultimate Strength

The strength of the three hold model was estimated considering uncertainties as shown in Figure 2.
Fig. 2: Factors affecting uncertainty in strength of the double bottom structure.
How was the yield stress of the structure calculated? The value of yield stress of the members were obtained from their respective mill sheets. The average of all the yield stress values of the different member materials were calculated and regarded as the mean value of hull girder ultimate strength (μ).

It is important to understand what was done next. Given the fact that the strength of a marine structure follows a probabilistic nature (that can be represented by a Probability Density), it is evident that consideration of mean value alone for determining the ultimate structure is not a valid thing to do. What if the strength of the structure at any point of time, reduces from its mean value? Therefore, it is necessary to determine the minimum ultimate strength of the structure to consider the worst case scenario.

Class NK adopted two different methods to determine the minimum hull girder ultimate strength, an the strengths obtained through each of the two methods were categorized as Case 1 and 2 (will be referred by the same hereinafter).

Case 1- The standard deviation (σ) of the yield strength of the bottom shell plates were calculated from the mill sheet values. The minimum yield stress of the hull girder was defined as the value that was less than the mean by three times the standard deviation, i.e. Minimum yield stress = μ-3σ (Refer to Figure 3)
The hull girder ultimate strength was then evaluated corresponding to the above minimum yield stress of the bottom plating. This ultimate strength was regarded as the minimum hull girder ultimate strength.


Fig. 3: Graphical representation of Case 1


Case 2- The hull girder ultimate strength was evaluated corresponding to the minimum yield stress of the bottom plating specified in the mill sheets. The obtained ultimate strength was then regarded as the minimum hull girder ultimate strength.
The obtained values of yield stress (for both the cases) were as shown in Table 2.


Table 2: Yield stress for Case 1 and Case 2.
Now, in order to find the ultimate strength, a very simple method was adopted: The loads at the time of the accident were known and categorized into the following:

  1. Hull weight corresponding to the double bottom structure (known before analysis)
  2. Hydrostatic pressure corresponding to the full draught (known before analysis)
  3. Container Loads (known before analysis, based on the loading information at the time of the accident)
  4. Allowable still water bending moment for hogging (calculated before the analysis, from loads 1, 2 and 3)
  5. Wave-induced pressure (priorly calculated from Class NK Direct Strength Analysis, 2012)
  6. Wave-induced vertial bending moment (calculated from IACS UR S11)
  7. Additional vertical bending moment (due to uncertainties)
The interesting part is how these loads were applied to the model for analysis. Initially, loads 1,2, and 3 were gradually increased every one second until they reached their known values. Then loads 4, 5, and 6 were applied in turn and increased every one second until their known values were attained. At last, load 7 was gradually increased every second until the stress in the structure exceeded the Von Mises Stress of the structure. (Graphical representation in Figure 4). The stress at which the structure failed, was regarded as the Hull Girder Ultimate Strength.

Fig. 4: Sequence of application of load on the model.
(Courtesy: Class NK)
The above method was followed for three conditions:
  1. When yield strength of the structure was corresponding to the mean value (μ)
  2. Case 1: Yield strength = μ-3σ
  3. Case 2
The hull girder ultimate strength was also obtained for three different conditions and the corresponding vertical bending moments were obtained, as shown in Table 3.


Table 3: Obtained values of Vertical Bending Moments when the hull girder fractured.
Fig. 5: Time vs. Bending moment at the section that suffered failure in the case of average yield stress. (Picture edited)
(Courtesy: Class NK)
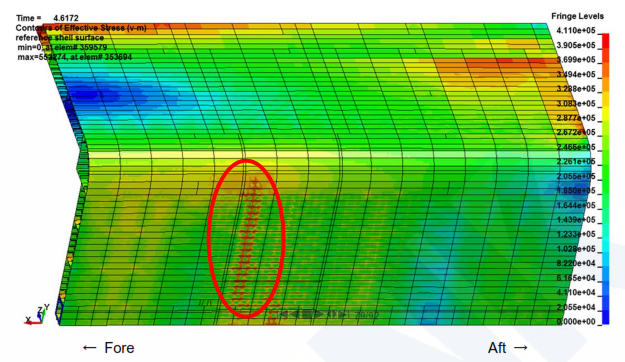
Fig. 6: Von Mises stress at the time of peak load.
(Courtesy: Class NK)

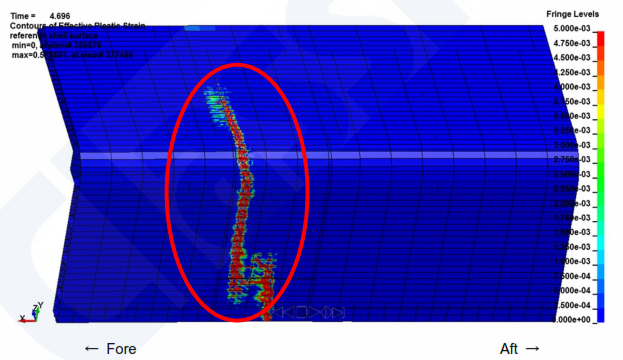
Fig. 7: Equivalent plastic strain at the time of peak load.
(Courtesy: Class NK)

Fig. 8: Von Mises stress at the time of peak load.
(Courtesy: Class NK)

Fig. 9: Equivalent plastic strain at the time of peak load.
(Courtesy: Class NK)

What's in Part 3?

Certain factors were multiplied to the obtained values of bending moment, in order to compensate for the factors of local deformations and residual stresses due to welding. Inclusion of these factors, reduced the strength further. It is on the basis of the then obtained strength values, that the probability and extent of damage will be discussed in the next part of this series.LSD


Article By: Soumya Chakraborty

Thursday, 9 October 2014

Integrated Masts-The Next Generation Masts

Fig. 1: UNIMAST : The Integrated Mast Family
(Image Courtesy: www.selex-es.com)
                                         
The heading truly lays an emphasis on the need of using integrated masts .Why do we need it? The use of conventional masts with dozens of antennas, doesn't it make a naval ship communication system more complicated?

Let’s discuss how this integrated masts will prove beneficial in near future!

We can call it a housing that accommodates all the radars, sensors and antennas of a naval vessel. Gone are the dozens of antennas and sensors found on practically every flat topside surface of a modern naval vessel. The presence of all these systems, however sophisticated and advanced they individually may be, on one ship creates several problems.

As we know, the best position for a sensor is on top of the highest mast. There's only one system that can benefit from this position; all the others will be blocked to a certain extent by this mast. All antennas, so close together will affect each other. On most naval vessels it is necessary to switch one system off before another antenna can be used. This has been the cause of some serious incidents.

Features


Integrated mast reduces electromagnetic interference and physical obstructions between electronic sub-systems, and improves across the board performance through the provision of a single operation centre.

UNIMAST represents the Selex ES’ solution to the need of enhanced air, surface and sub-surface defence effectiveness in the naval domain.Let us discuss some of its benefits

Fig. 2:Main Systems Antennas Positions
(Image Courtesy: www.thalesgroup.com)

UNIMAST enhances operational effectiveness across all present and future scenarios:

  • Anti-aircraft and anti-missile defence.
  • Counter-fire.
  • Improved search and track capabilities, against asymmetric threats like small manned or unmanned aircraft at low altitudes and at low speed.

  • Reduced ship radar cross-section.
  • Improved flexibility for different operating conditions, such as littoral surveillance or blue water operations.
In order to meet ever more demanding operational needs, the integrated mast includes:
  • Surveillance radar and air and surface tracking by means of multifunctional AESA 3D four fixed face radars ,operating in C-band (two versions: MFRA and KRONOS) and X-band (two versions: 2D and 3D)
  • A phased array IFF using a conformal antenna and operating up to Mode number 5.
  • An optronic system.
  • Integrated communication system, including tactical data links.
  • Electronic Warfare system integration.

The Selex ES UNIMAST Integrated Mast Features


  • Surveillance radar and air and surface tracking by means of multifunctional AESA 3D four fixed face radars, operating in C-band (two versions: MFRA and KRONOS) and X-band (two versions: 2D and 3D).
  • Electro-optical system. Passive air and surface surveillance and tracking. Infra-red (IR) mapping to support threat evaluation and classification.
  • Communications. Data links  and satellite communications system, line-of-sight VHF and UHF communications, Link 11 and Link22 UHF, Link16 Rx and satellite communications.

Let’s know the radars- In The Thales Integrated Mast eliminates these problems. All radars and antennas not only have a full 360° field of view; they are also developed so as to operate simultaneously without interfering each other.
Fig. 5: Integrated Mast tracking features
(Image Courtesy: www.thalesgroup.com)

The radars in the Integrated Mast are non-rotating, four-faced active phased array radars, which in itself is a major performance enhancement. As the four faces operate simultaneously, the radars achieve four times the time on target achieved by a rotating radar. The surface surveillance radar (Seastar) was developed especially for this purpose and it is capable of detecting and tracking small objects (e.g. divers' head) between the waves, contributing enormously to situational awareness in littoral environments.


How is it installed?


The Mast is tested as one system. Not before it fully complies with the customer's specifications is it transported to the shipyard. There, the Integrated Mast is simply bolted or welded to the ship, hooked up to the power supply, coolant system and data transmission and is operational in only two or three week time. Compared to the one year that is necessary to install, integrate and test all the separate systems, this is a huge time and money saving option, for Navy as well as shipyard.
The system’s support has also been simplified, providing access from within the mast, and protecting much of the electronics and cabling from wind, and corrosion.

Fig. 6: Holland-Class Offshore Patrol Vessel / OPV
(Image Courtesy: www.seaforces.org)
This system has been installed on the Patrol Ships for the Royal Netherlands Navy .The first one was scheduled to be operational in late 2010. The I-Mast 100, introduced in September 2009, is the second member of the I-Mast family. This system is designed for smaller, corvette-sized vessels. The type of systems in the Mast is completely up to the customer. Although the Integrated Mast for the Holland class OPVs for the Royal Netherlands Navy contains mostly Thales systems, it will be possible to use customer-furnished or third party systems in a Thales Integrated Mast

Below are some videos about the Thales Family of i-Masts and their integration in ships and benefits.LSD


Article By: Siddhi Indulkar

Recommended Visuals1.) Thales presents: The i-Mast Family
                                2.) Thales Integrated Sensor Mast

Saturday, 4 October 2014

MOL Comfort- What Happened? (Part 1)


On 17th June 2013, MOL Comfort, a post Panamax container ship owned by Mitsui OSK Lines suffered a crack amidships and split off into two off the coast of Mumbai. It turned out to be one of the biggest structural failures in the history of container shipping, and the reason behind the same remained unknown unless a dedicated investigation was carried out into the matter by Class NK, who recently released their final investigation report on the case. 

This provides a great chance for designers to make reconsiderations and learn ship structure design from a different point of view. This series of articles are a detailed analysis on the investigation carried out by Class NK. The aim of launching this series is to give an interactive and informative insight into the entire investigation which fosters a better way of learning structural design than just what books and professors can do. It is also assumed that you have a basic touch up on ship structures before you read on.

The fracture generated from the bottom shell of the double bottom structure of the ship. The condition shown in Figure 1 is one of a later stage when the crack had propagated above the waterline. But the origination of the crack was investigated and found to be at 200 mm fore of Frame 151 (as shown in Figure 2), where there was a butt weld (remember this throughout the entire analysis). Also, the entire analysis was carried out on the double bottom structure at the hold corresponding to the area of crack generation and half of each hold fore and aft of the hold where the crack generated.

Fig. 1: The crack originated in the bottom shell and propagated above the waterline.
(Image Courtesy: Google Images)

Fig. 2: Actual position of generation of crack.
(Image Courtesy: Class NK)
The load on a ship not only depends on its cargo loading conditions but also on the environmental factors, which we collectively call as Sea State. The cargo loading conditions were obtained from the shippers (weight of each container along with the container loading plan). However, it can never be affirmed that the data obtained was correct, given the fact that many shippers practice in overloading the containers, which is often not a design standard in terms of the ship's strength. 


Estimation of Wave-Induced Loads (Considering Uncertainties)


The environmental conditions (wave induced loads) during the accident were recorded. But as ships always operate in an environment of periodically varying parameters, it is a common practice to consider certain deviations in the recorded data for a wider analysis. Class NK has pretty much done the same in their investigation. Considering certain deviations in the parameters of wave and wind induced loads, Class NK proceeded with the following data as shown in Table 1.

Table 1: Deviated values of wave induced load parameters during the accident.
(Image Courtesy: Class NK)

But how did they get to these values? Based on the recorded data during the accident, the sea state and load response on the ship was simulated probabilistically for 27 different scenarios. Since each load condition would subject the hull to a specific wave-induced vertical bending moment, a probability distribution was plotted against the possible values of the wave induced vertical bending moment and the frequency of occurrence of each, as shown in Figure 3. For each of the 27 conditions, 1000 waves (short term sea state) were considered for the simulation. Note how the frequency of occurrence of extreme maximum and minimum bending moment are lower than that of the occurrence of an averagely medium value.

Fig. 3: Frequency of occurrence of various wave induced vertical bending moments.
(Image Courtesy: Class NK)
For a better understanding, Table 4 shows the obtained parameters when the wave induced vertical bending moments were maximum and minimum. This is how the wave load parameters were considered with estimated deviations for more accuracy.

Table 2: Wave induced load parameters in case of maximum and minimum wave induced vertical bending moments.
(Image Courtesy: Class NK)

Uncertainty in Strength

Fig. 4: Factors that definitely affect the strength of the double bottom structure.

Fig. 5: Factors affecting uncertainty in strength on the structure.


What's in Part 2?

In Part 2 of this series, we will see how these uncertainties were used to estimate the strength of the double bottom structure probabilistically, rather than deterministically. The importance of probabilistic determination lies in the fact that ship structural failures may not occur in load scenarios which occur very frequently. It is the less frequent but most adverse conditions that lead to such failures. This makes it necessary to analyse the failure from a probabilistic point of view.LSD


Article By: Soumya Chakraborty


Thursday, 2 October 2014

Back To Nature

It is not uncommon to come across technology borrowing inspiration from mother nature and the shipping industry has not been late in adapting to the trends. Natural systems are often quite efficient. Sometimes when faced with complex challenges in design and construction, it is often fruitful for us us to take clues from the billions of years of the process of evolution which has selected only 'fit' designs.

Today, the technologies which you are about to get introduced to are all potential breakthrough technologies which may one day become reality. We shall talk of bio-mimicry and the use of live organisms for various purposes in marine systems. 


Biofouling


Bioflouling is the build-up of both micro/macroscopic organisms on surfaces of the ship exposed to the sea i.e. primarily the hull and adds to the fuel consumption of a vessel from years of accumulation as a result of which there is an increase in the environmental effects like release of oxides of sulphur and carbon. All of these are caused due to the increase in the hydrodynamic drag from the increased mass and it's resulting interactions with flowing water, both slow and fast.

As in other cases, the technologies which we have come up with for reducing biofouling which are nature inspired have significantly reduced costs, wastage of resources.In this case, the skin of sharks seems of interest to researchers.
Fig. 1: A close up of shark skin 
(Image Courtsey: biomimicryinstitute.org)


The microscopically small individual scales of shark skin, called dermal denticles or “little skin teeth”, are ribbed with longitudinal grooves which result in water moving more efficiently over their surface.
Over smooth surfaces, fast-moving fluids begin to break up into circulating currents, or eddies, due to the velocity gradient which exists across layers. These eddies are reduced in number by this kind of surface venation.Some of the features are:

(1) The grooves channelize the flow as evident from the figure.They also reduce the sizes of vortices by dividing the water 
sheets areas into smaller ones, an approach somewhat analogous  to reducing eddy currents in transformers by dividing the area into smaller compartments.

(2) They speed up the slower water at the surface by reducing the area of outflow which means same volume flow happens through a smaller volume (consistent with mass conservation), reducing the surface flow velocity gradient with respect to the shark skin.

Think about it, who knows someday we might even come up with latest improvements like biomorphic mineralization applicable to creation of marine materials.


Hydrophobic Hulls


The water fern, by nature is super hydrophobic, which means it does not get wet even when immersed because of small, fibrous hair that keep a thin layer of air close to the plant's body. 


Fig. 2: Hydrophobic hulls may be next 
big innovation in Hull Engineering 
(Image Courtsey:Google Images)
Ships consume more fuel with increasing drag on the hull. Bio-mimicry research has been looking looking forward to water fern for to help ships move faster and save energy resources.It is said that the researchers can design container ships having hulls with similar super-hydrophobic properties, keeping a layer of air between water and vessel hull.

If researchers could design container ships that have hydrophobic hulls, fuel costs and emissions could be reduced by as much as a valuable ten percent.


Considering that global shipping emission estimates stood at around 850 million tons of CO2 in 2007 which is nearly 3 percent of man-made emissions that year, this is definitely no minor reduction. The researchers estimate such technology could trim a full percent off global fuel consumption.


Submarine Designs


"Most fish wag their tails to swim. A stingray's swimming is much more unique, like a flag in the wind," Richard Bottom, a mechanical engineering graduate student at the University at Buffalo, said in a statement.


Fig. 3: 3D Maps of the way vortices flow around swimming Stingrays 
(Image Courtsey: www.livescience.com & Richard Bottom)


A study by the students at Harvard University and University at Buffalo focused on motion of Stingrays, which are cartilaginous fishes.They studied the dynamics of motion of their round and flattened bodies and how they appear to 'ripple' through water. The ''Leading Edge Vortex'', as it is so called because of it being at the front of a body in motion, creates the low pressure at the front and high at the end.

Although a common phenomenon in birds and insects, this seems to be the first case of the phenomenon being observed in underwater motion.


Strait Power Turbines


The inspiration for designs from sharks are not only limited to anti fouling materials. It is seen that a shark, which in this case is the basking shark, spends a larger part of the day open mouthed, in the process it allows water to enter through its mouth and out through the gills while aiding in swimming.

Fig. 4: Concept rendition of the the principles of fluid movement 
in a basking shark
(Image Courtsey: www.designboom.com/)

Industrial Designer Anthony Reale’s Strait Power provides a highly efficient redesign 
of water-powered turbine generators. Given below is a 3-D rendered model of the pressure differential and water movement that is responsible for the high energy efficiency of ‘strait power'.


Fig. 5: Artistic rendering of the pressure differential and water movement that is responsible for the high energy efficiency of ‘strait power'
(Image Courtesy: www.designboom.com)

Fig.6: Rendered structural images of ''Strait Power'' prototype 
(Image Courtesy: www.designboom.com)

The team calculated that this prototype already improves power output of a single turbine blade by 40%, a figure Reale expects to improve in later versions.


Air bubbles against drag

The next source of inspiration from Mother Nature comes from these lovely creatures inhabiting the Polar Regions. Penguins use air bubbles for lubricating their passage in water. This concept is being applied to vessels for improving their performance by increasing their efficiency and lowering the drag. Sounds pretty routine? Here's something to note however, the penguins release the bubbles from the air trapped in their feathers.

Ships however use a air bladder to exploit this effect. At the stem of the ship, a combination of compressors and shell cavities release the stream of pressurised air bubbles which form a carpet along the hull of flat bottomed vessels. This technology has been used for trials onbaord oil tanker vessels with increase in efficiencies averaging around 4%.

Fig.7: Penguins surging through water. Note the air bubble stream behind them.
(Image Courtesy: www.bbc.com)

The first commercial installation of the technology, (now known as) Silverstream® system is expected to be fitted on a Norwegian cruise liner. This technology could improve ship energy efficiency by more than 5%.


Fig.7: Schematic representation of the Silverstream® Technology
(Image Courtesy: www.shell.com)

What Else


We often think of how to implement intelligent control and automation of tasks which have been traditionally solved by humans.One school of thought often suggests-''Why not use humans to carry out automated tasks?'', on similar lines, another school suggests- ''Why not use biological organisms to do the same? ''.How far can this idea go?

Something you might however point out against the first school of thought is that there is a desire to remove the need for humans to perform simple and boring repetitive tasks so that they can pursue more enjoyable and involving tasks.LSD


Article By: Sudripto Khasnabis

Recommended Readings: 

3. Bio-mimicry for Optimization, Control, and Automation (Book) By Kevin M. Passino